
The article below was contributed by Timothy Malche, an assistant professor in the Department of Computer Applications at Manipal University Jaipur.
Measuring plant growth is essential for several reasons in agricultural, ecological, and scientific contexts. For example, plant growth metrics provide valuable information for use in optimizing crop yield, managing ecosystems, studying environmental changes, and conducting research in plant biology.
In the field of biotechnology, researchers use plant growth measurements to assess the effects of genetic modifications and to develop crops with improved traits, such as resistance to pests, diseases, or environmental stress.
There are a few metrics used in monitoring plant growth, which include:
- Height measurement
- Leaf area measurement
- Biomass measurement
- Stem diameter measurement
- Root growth measurement
In this blog post we will show how computer vision can be used to monitor plant growth. We will focus on the height measurement technique.
Methodology
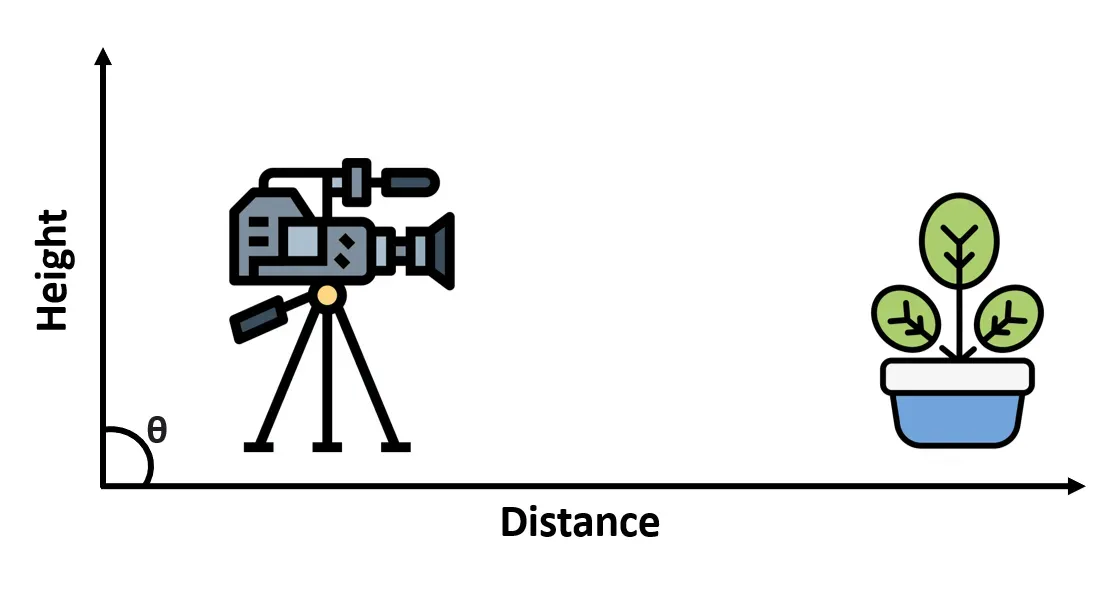
First, a camera sensor node is used to acquire an image of the plant. Subsequently, a computer vision model is used to process the image, extracting relevant features and calculating the plant's height, which is then returned as an output. While acquiring the plant images using a camera, the camera height, distance, angle is an important factor.
To determine the height of a plant in an image using computer vision, following steps are used
- Calibrate the camera height and distance from the plant and a reference object (6-inch object in our case) from the same perspective and distance as plant images.
- Train the computer vision model using an object detection algorithm to identify both the reference object and the plant in the images.
- Extract the bounding boxes for the detected reference object and the plant.
- Calculate the pixel height of the reference object's bounding box in the image. Use the known physical height of the reference object (6 inches in our example) to establish a pixel-to-inch conversion factor.
- Apply the conversion factor to the pixel height of the plant's bounding box to obtain the actual height of the plant.
Keep in mind that lighting conditions and image quality can also affect accuracy, and fine-tuning may be required for optimal results.
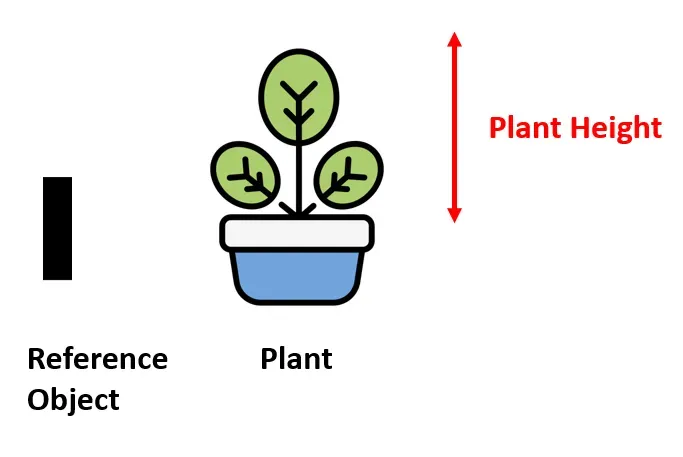
Using the technique present in this post, either single plant can be monitored,
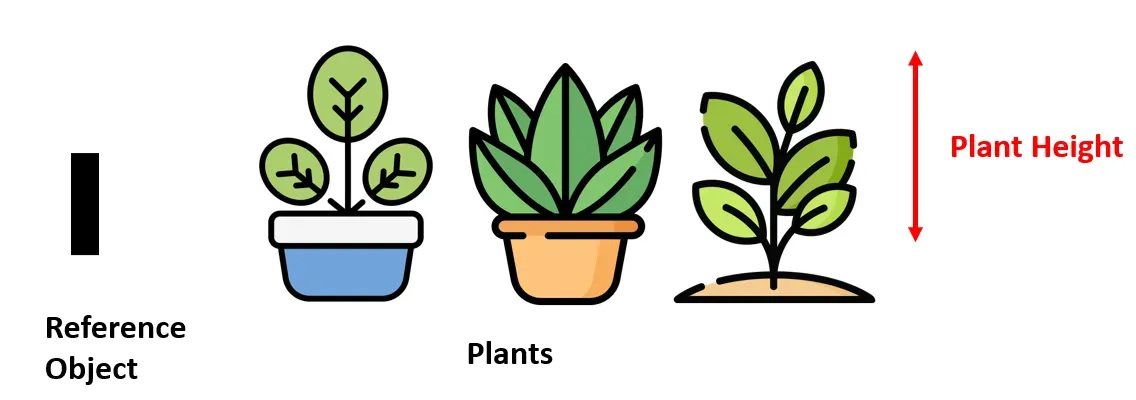
Or, multiple plants can also be monitored with the help of a single reference object given that it should fit in the camera frame.
Steps for Building the Project
To build this project, we will follow these steps:
- Collect and label a dataset of plants
- Train an object detection model
- Run Inference to obtain bounding box details
- Write an algorithm to calculate the height of the plant
Step #1: Collect and label a dataset of plants
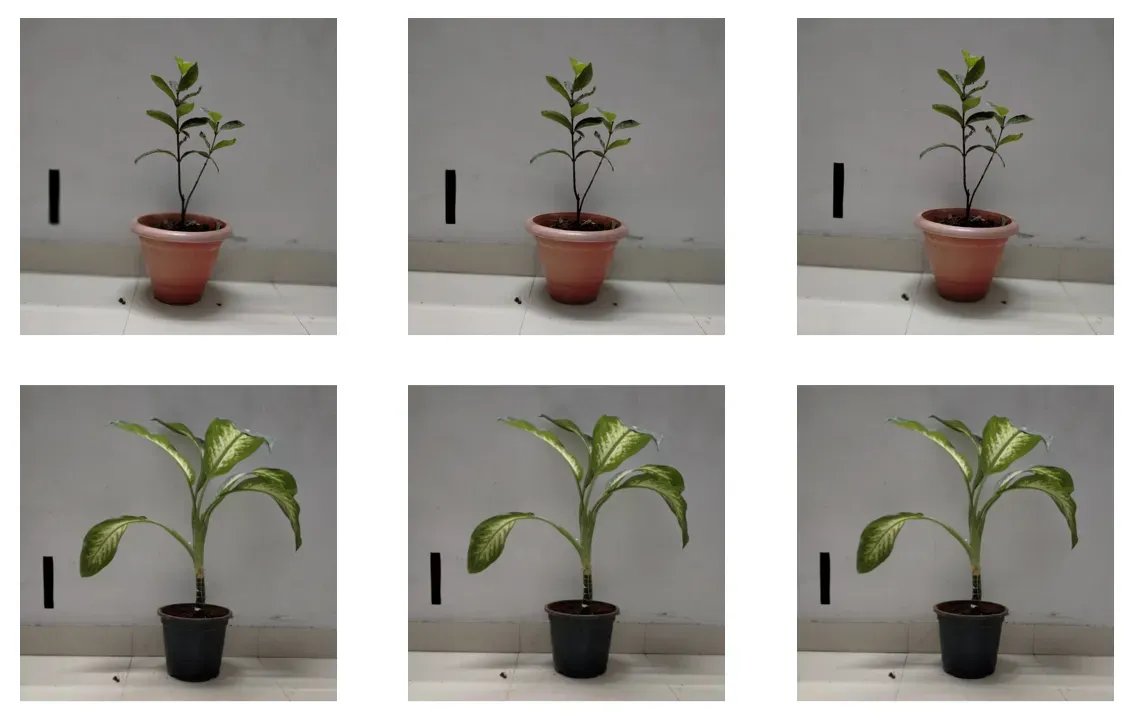
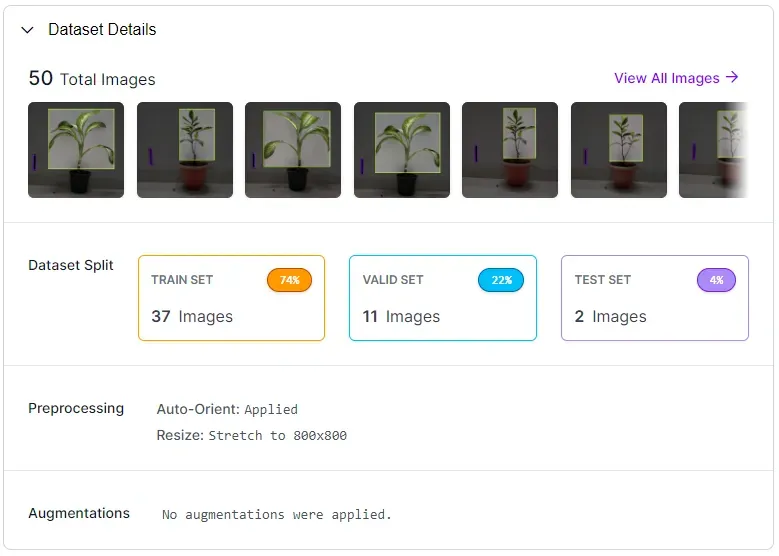
Images dataset of the plant at different intervals has been collected manually as shown below:
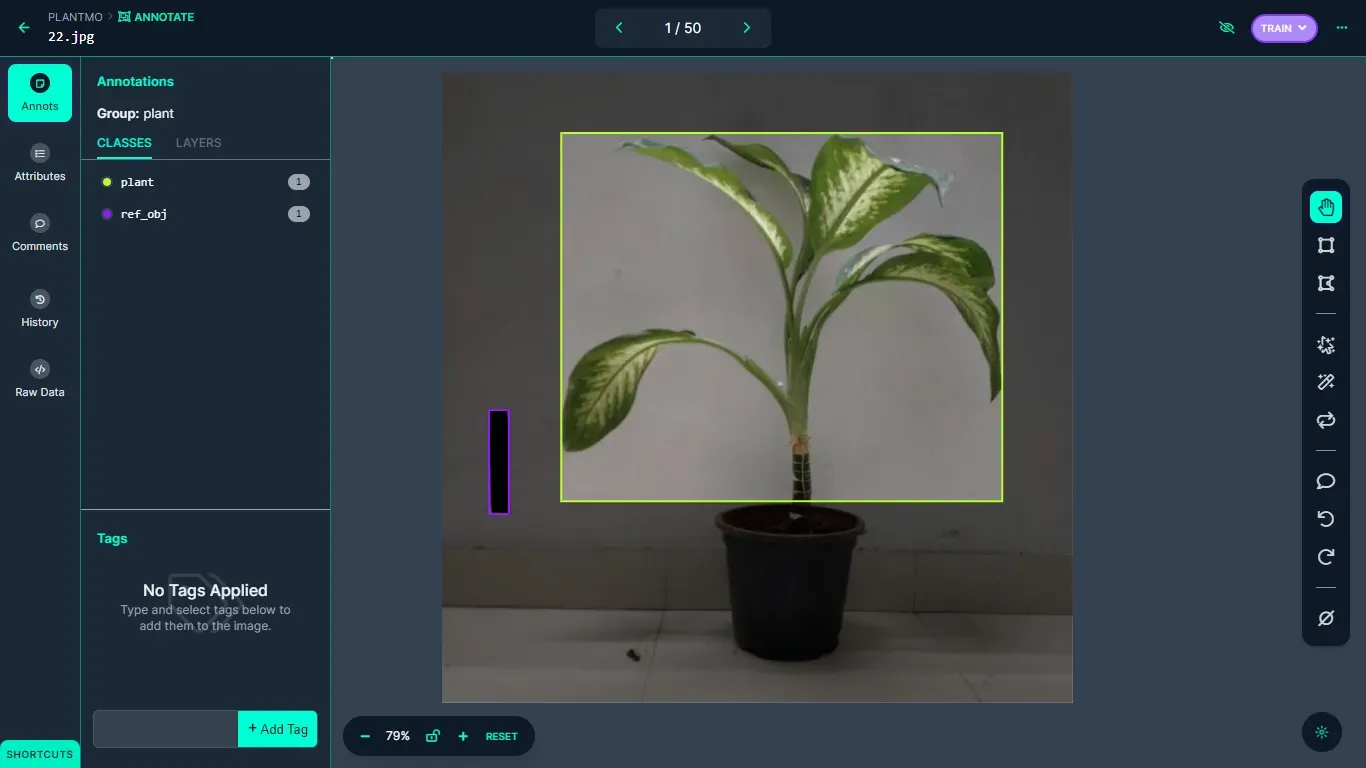
The images are then uploaded to Roboflow platform and are labelled using the bounding boxes. Both the plant and the reference objects are labelled, as shown below.
Step #2: Train the Model
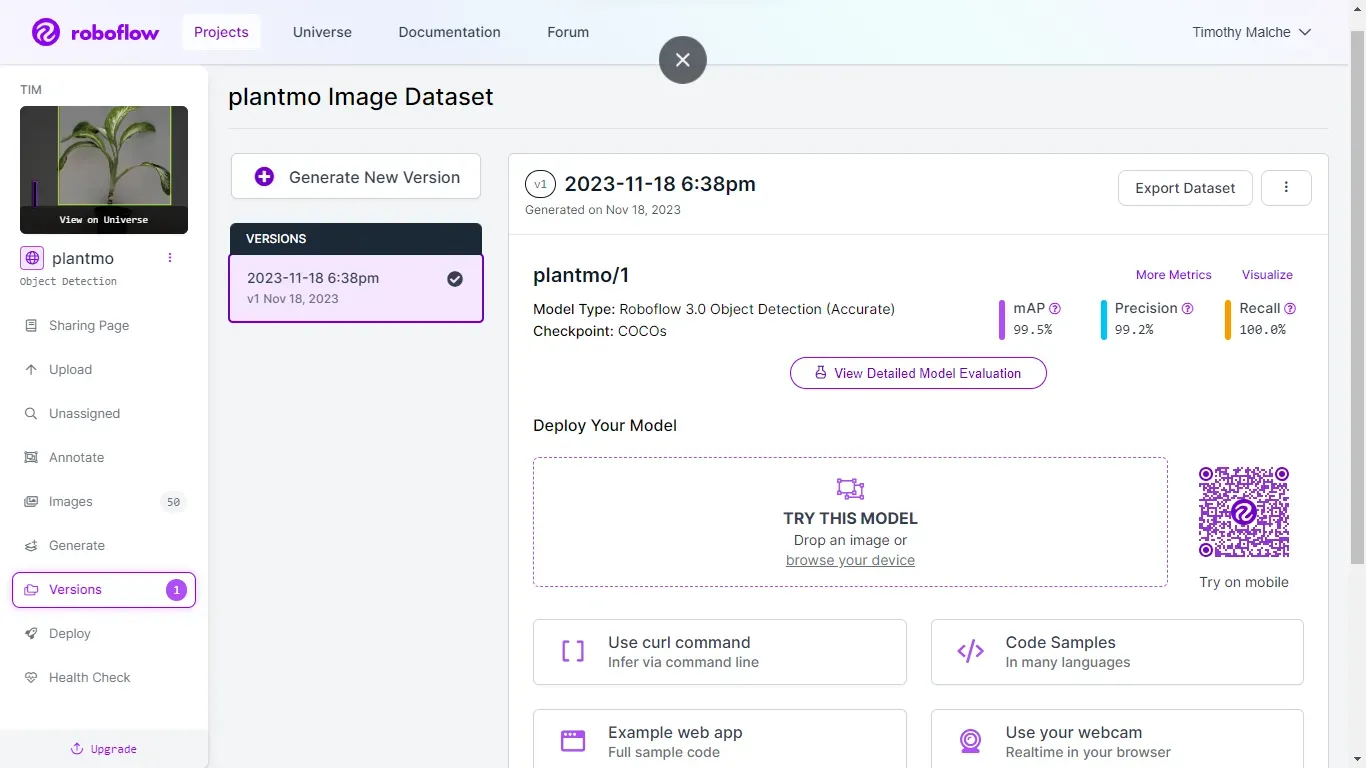
After labelling is done, the dataset version is generated and the model is trained using Roboflow auto-training option.
The training accuracy achieved is 99.5%.
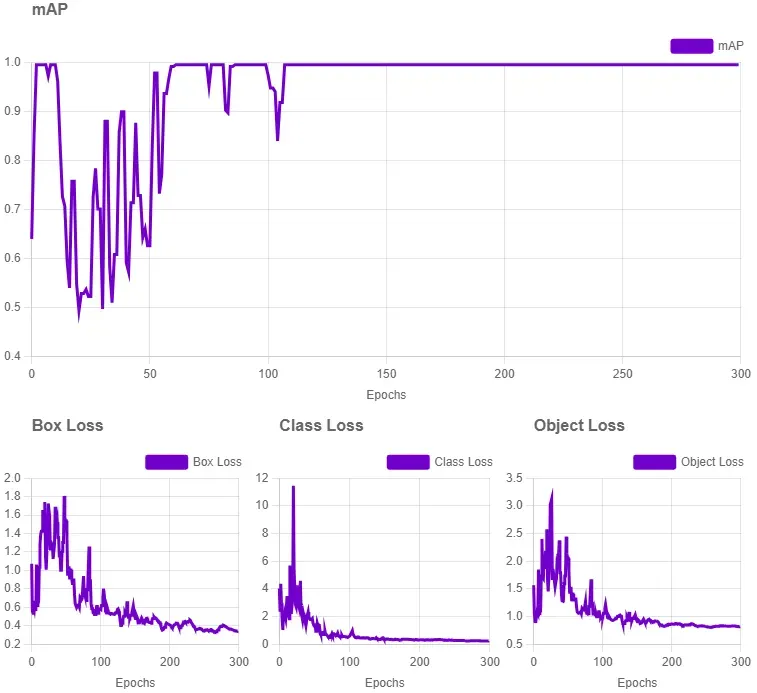
The following training graph visualizes how the model was trained.
Step #3: Run inference to obtain bounding box details
After training the model, Roboflow inference API is used to run inference and obtain the bounding box details. The following predict()function from the Roboflow Python SDK is used which returns the bounding box details in JSON format
model.predict("/content/50.jpg", confidence=80, overlap=50).json()Using Roboflow Python SDK, an algorithm is developed which writes the resultant JSON values in a .json file required for later use.
You can install the Roboflow Python SDK using the following command:
pip install roboflowThe following code illustrates how it is done.
from roboflow import Roboflow
import json

from roboflow import Roboflow
rf = Roboflow(api_key="YOUR_API_KEY")
project = rf.workspace("tim-4ijf0").project("plant-monitoring-oxvkg")
model = project.version(1).model

predictions_json = model.predict("50.jpg", confidence=40, overlap=30).json()

output_json_path = '/content/detection_results.json'

with open(output_json_path, 'w') as json_file:
    json.dump(predictions_json, json_file, indent=2)

print(f"Predictions saved to {output_json_path}")
The generated detection_results.json file contains data in following format:
{
  "predictions": [
    {
      "x": 428.0,
      "y": 294.5,
      "width": 280.0,
      "height": 395.0,
      "confidence": 0.9443135261535645,
      "class": "plant",
      "class_id": 0,
      "image_path": "50.jpg",
      "prediction_type": "ObjectDetectionModel"
    },
    {
      "x": 86.0,
      "y": 450.5,
      "width": 26.0,
      "height": 137.0,
      "confidence": 0.8782252073287964,
      "class": "ref_obj",
      "class_id": 1,
      "image_path": "50.jpg",
      "prediction_type": "ObjectDetectionModel"
    }
  ],
  "image": {
    "width": "800",
    "height": "800"
  }
}
The Roboflow python SDK returns the values in following format which has been stored in detection_results.json file
- x = the horizontal center point of the detected object
- y = the vertical center point of the detected object
- width = the width of the bounding box
- height = the height of the bounding box
- class = the class label of the detected object
- confidence = the model’s confidence that the detected object has the correct label and position coordinates
Here, the x, and y coordinates represents center point of the detected object. When visualizing the bounding boxes in the resultant image using the values from detection_results.json file, the center coordinates needs to be converted to corner points as done in the step 4.
Step #4: Write algorithm to calculate the plant height
In this step we calculate the height of the plant. An algorithm is written to calculate the height of the plant by reading the values from detection_results.json file and visualize the result using bounding boxes.
First define functions to calculate the pixel height and establish the conversion factor.
def calculate_pixel_height(bbox):
  return bbox['height']

def establish_conversion_factor(reference_height, reference_pixel_height):
  return reference_height / reference_pixel_height
Then write algorithm to calculate the height of the plant and visualize the result. The following function process_object_detection_results()first read the detection_results.json file to extract the bounding box information for reference object and plant using following lines of code
reference_bbox = next(item for item in detection_results['predictions'] if item['class'] == 'ref_obj')

plant_bbox = next(item for item in detection_results['predictions'] if item['class'] == 'plant')
Then calculate_pixel_height() function is called which uses reference objects bounding box details passed to it as parameter to calculate the pixel height:
reference_pixel_height = calculate_pixel_height(reference_bbox)After this the establish_conversion_factor() function is invoked with actual physical height of the reference object, 6 inch in this case, and pixel height of the reference object calculated above in order to determine pixel to inch conversion factor.
reference_height_inches = 6
conversion_factor = establish_conversion_factor(reference_height_inches, reference_pixel_height)
Then the pixel height of the plant is also calculated and the obtained conversion factor is used to map the pixel height of the plant to inches, which is our resultant value.
plant_pixel_height = calculate_pixel_height(plant_bbox)
plant_height_inches = plant_pixel_height * conversion_factor
Finally, the bounding boxes are generated on the output image. The following lines of code are used to convert the center points (x, y) of both reference object and plant object to top left corner points (x1, y1) of the bounding boxes to properly visualize the bounding boxes from the inference prediction, as specified in this section.
xr = reference_bbox['x'] - (reference_bbox['width']/2);
yr = reference_bbox['y'] - (reference_bbox['height']/2)
reference_box = [

    round(xr),
    round(yr),
    round(xr + reference_bbox['width']),
    round(yr + reference_bbox['height'])
]

xp = plant_bbox['x'] - (plant_bbox['width']/2);
yp = plant_bbox['y'] - (plant_bbox['height']/2);
plant_box = [
    round(xp),
    round(yp),
    round(xp + plant_bbox['width']),
    round(yp + plant_bbox['height'])
]
The labels on the bounding boxes are then specified and output image is generated.
cv2.rectangle(image, (reference_box[0], reference_box[1]), (reference_box[2], reference_box[3]), (0, 255, 0), 2)
cv2.rectangle(image, (plant_box[0], plant_box[1]), (plant_box[2], plant_box[3]), (0, 0, 255), 2)
font = cv2.FONT_HERSHEY_SIMPLEX
label_y_offset = 20
cv2.putText(image, f"Reference Object Height: {reference_height_inches} inches", (reference_box[0], reference_box[1] - label_y_offset),
font, 0.5, (0, 255, 0), 2, cv2.LINE_AA)
cv2.putText(image, f"Plant Height: {plant_height_inches:.2f} inches", (plant_box[0], plant_box[1] - label_y_offset),
font, 0.5, (0, 0, 255), 2, cv2.LINE_AA)
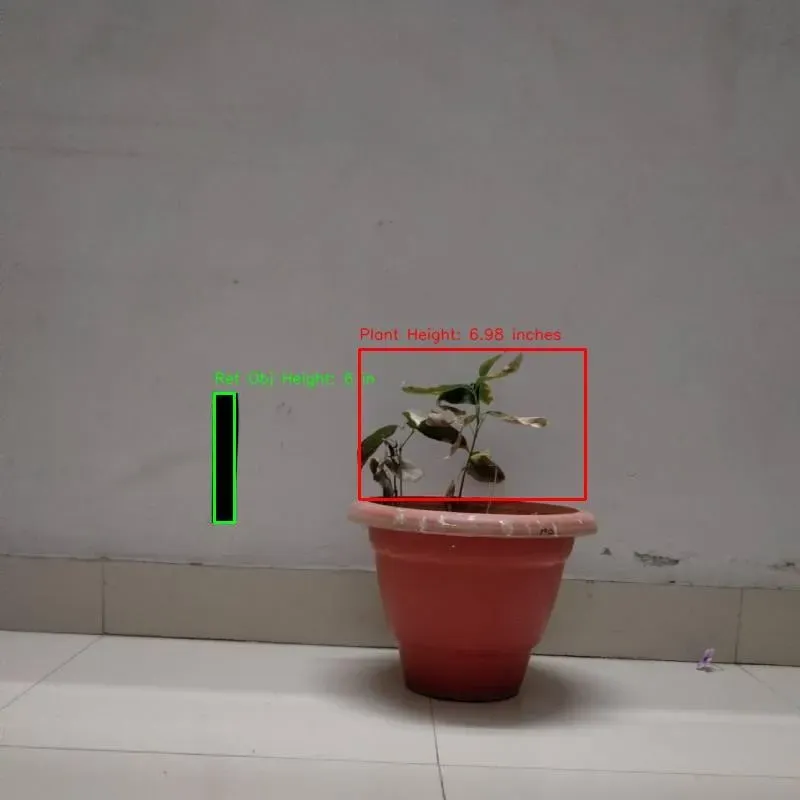
cv2.imwrite(output_path, image)The following is the output image generated by the algorithm which draws bounding boxes on each object and writes height details above bounding boxes.
Here is an example of our model running on another plant:
Comparing the above output images to real physical measurements of the plant, we can clearly see that the algorithm is accurately calculating the height of the plant.
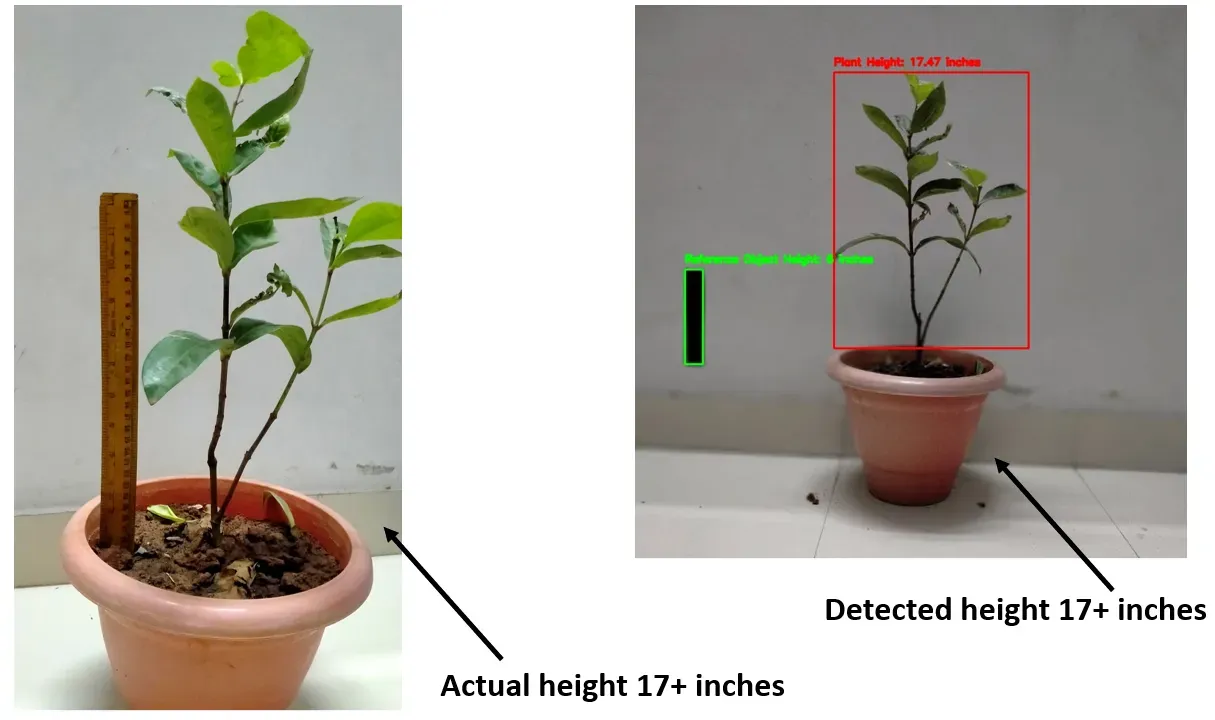
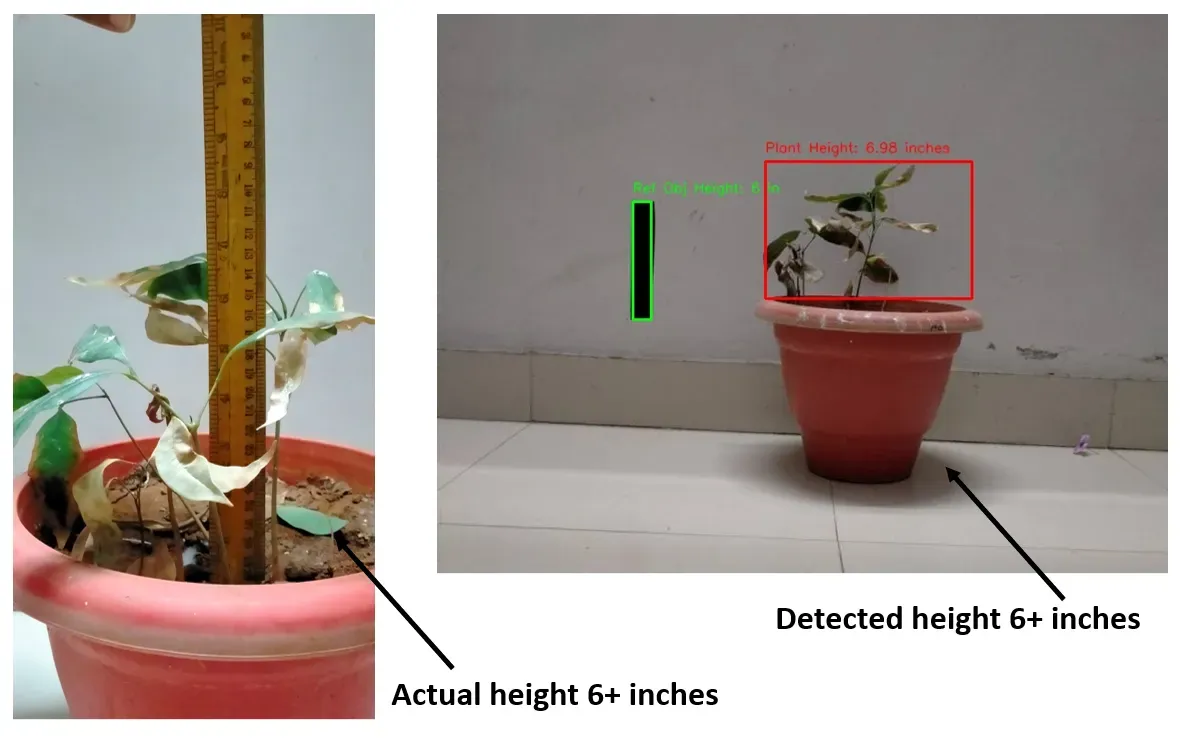
These results demonstrate that the model accurately detects objects, and the algorithm designed to calculate plant height performs with precision.
Conclusion
In this project, we implemented a computer vision pipeline for plant height measurement using computer vision.
Using object detection results from a computer vision model, our code extracts information about the reference object and plant, calculates their heights in inches, and annotates the original image with labelled bounding boxes. The resulting annotated images provide a visual representation of the measured plant heights, offering valuable insights for agricultural and research applications.
Through the described project-building steps in this blog, a remote plant monitoring system can be created which enables scientists to study growth patterns, monitor the effects of environmental factors, and conduct experiments in plant biology and farmers to optimize crop management strategies based on accurate plant height data.
All code for this project is available at GitHub. The dataset used for this project is available on Roboflow Universe.