
After you have trained a version of your computer vision model, there is always the question “how can I improve this model?” There are many answers, depending on the project on which you are working. One fact is consistent across all models: visualizations that help you see how your model performs on different images can inform the steps you take to improve your model.
We are excited to announce the launch of vector analysis, an extension to the model evaluation features available in the product. With our vector analysis tools, you can:
- View a scatter plot showing images in your dataset plotted according to their semantic similarity;
- Identify clusters of images in your dataset;
- Visualize images with low f1 scores, information you can use to inform changes to the next version of your model;
- Amend annotations for images with low f1 scores;
- And more!
In this guide, we are going to showcase how to use the Roboflow vector analysis tool. Without further ado, let’s get started!
How to Use Vector Analysis in Roboflow
Vector analysis is available for all paid Roboflow accounts. After you train a new object detection model on Roboflow, a model evaluation including vector analysis will be run. Note: You cannot use vector analysis for models that were not trained on Roboflow.
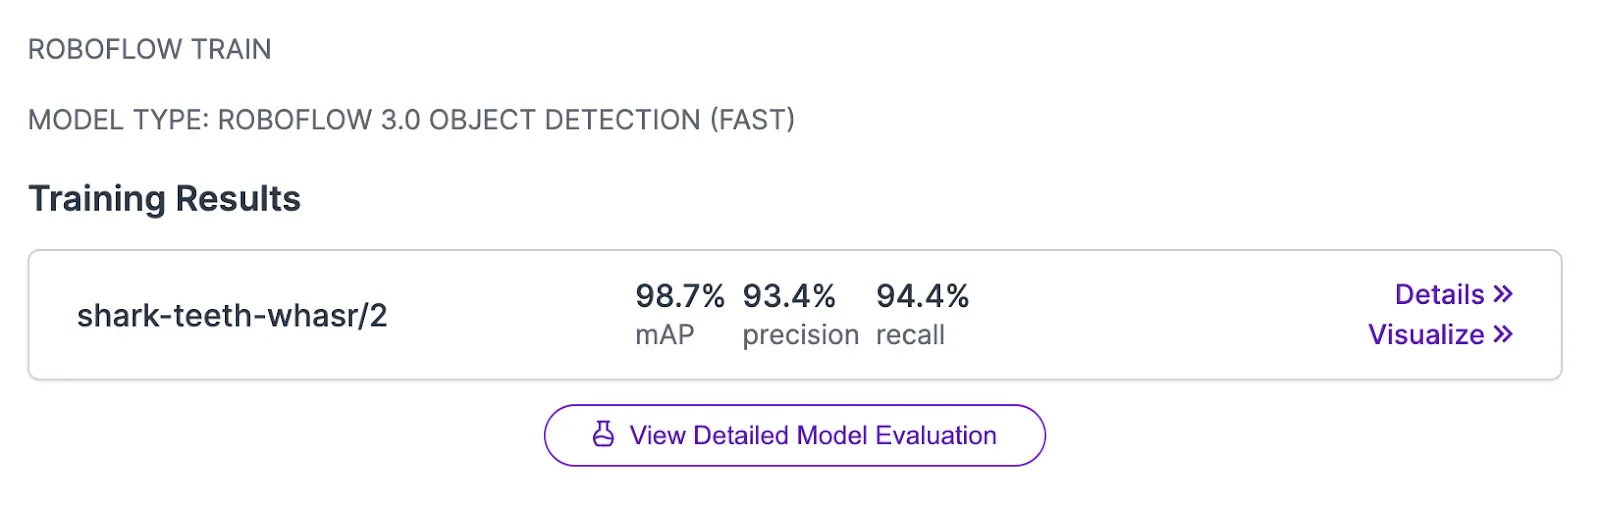
Model evaluation can take some time to run depending on the number of images in your dataset. Once the evaluation has finished, you can find it by clicking on the “View Detailed Model Evaluation” button on the Model page associated with your newly-trained model:
When you click the button, a confusion matrix will appear showing an aggregate view of how your model performed when evaluated in your test dataset. You can use the confusion matrix to identify images with predictions that were both correct, incorrect, and missing.
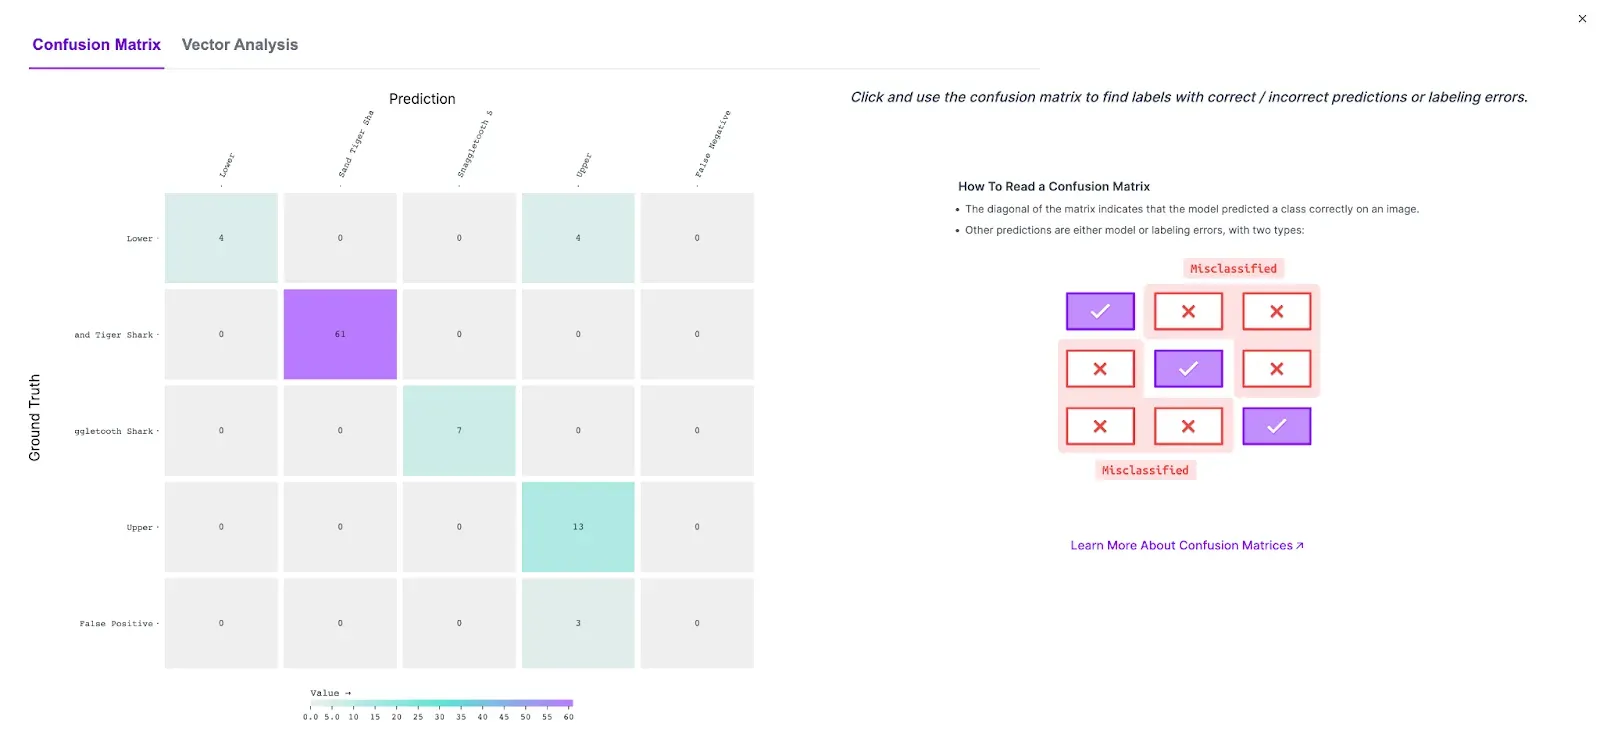
Click on the “Vector Analysis” tab to view the vector analysis:
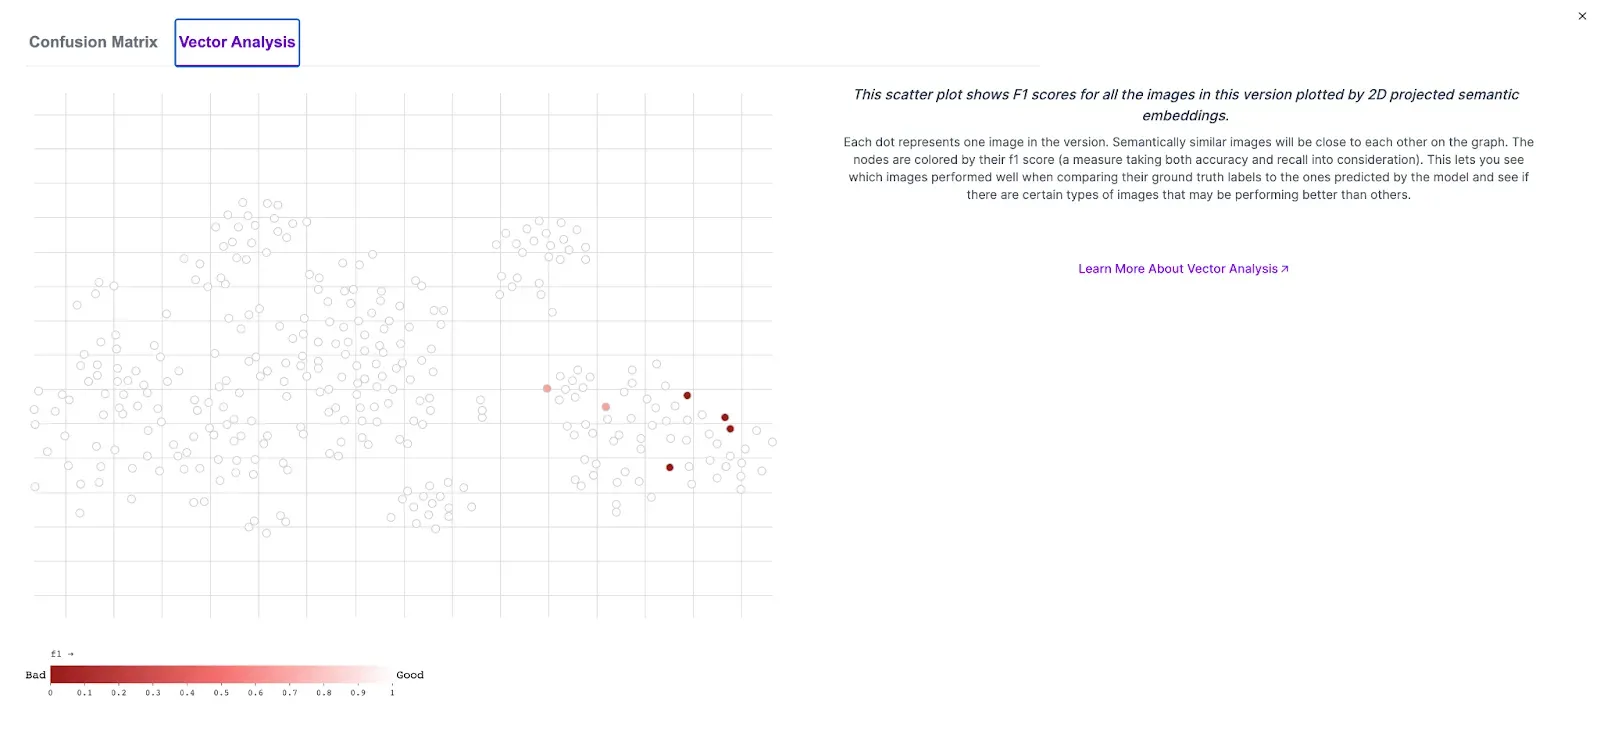
On this tab, a scatter plot appears. Each dot on the plot represents an image in your dataset version, including transformed images. Hover over each dot to see the associated image.
Images are clustered according to their semantic similarity using the CLIP embeddings calculated for all images stored on Roboflow. This allows you to find clusters of images that are similar to each other and outliers in your dataset.
The dots will appear on a spectrum from red to white. The deeper the red color, the lower the f1 score was for predictions on that image. Lower f1 scores mean a higher rate of your model returning an unexpected result (i.e. a false positive, missing an object when compared to ground truth).
You can click on any dot to save it to the side panel. This allows you to view multiple images together:
Above, all images with a low f1 score are selected. You can click into an individual image to compare ground truth to the results of your model:
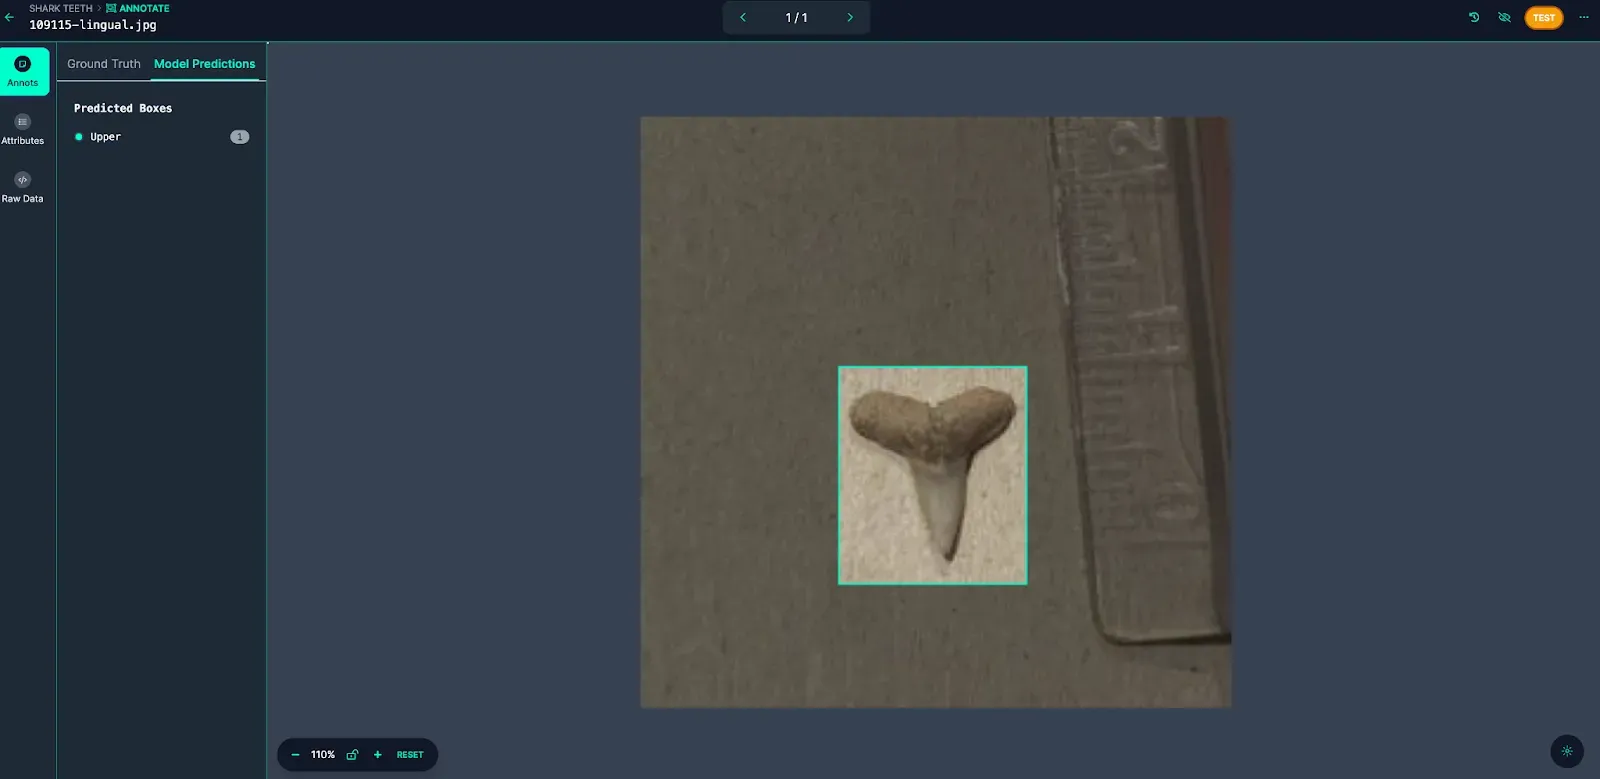
By default, the model predictions are displayed. Click “Ground Truth” to view the label(s) from your dataset:
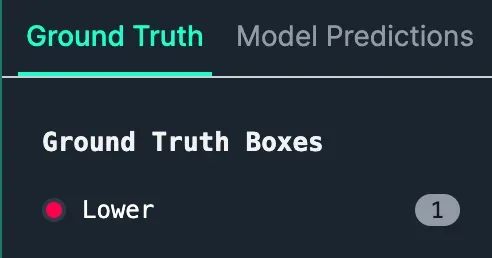
In this example, the model identified the tooth as “Upper” when the tooth was “Lower”.
Reviewing other images, we can see this is consistent. This suggests we may need to add more lower teeth images representative of the images where there were misidentifications to help our model identify this class with a higher degree of accuracy.
We recommend clicking on images with low f1 scores so you can see patterns. Images with low f1 scores that are scattered across the plot suggest there may be labeling issues in your dataset. For example, an ontology may not be consistently applied across the dataset, or images may be missing annotations.
Images with low f1 scores concentrated in a particular area suggest you could improve model performance by adding more images similar to those in the clustered area. These images should be sufficiently different to help your model generalize.
With the insights you derive from vector analysis, you can start to plan changes to your underlying dataset for use in training the next version of your model.
Conclusion
Vector analysis is now available to all paid customers for object detection models trained from today. You can use the Roboflow vector analysis feature to identify clusters of images in your dataset. You can find images where the model has performed poorly, and use that information to identify patterns where your model performs less well.
Using vector analysis, in addition to the confusion matrix features available in Roboflow model evaluations, you can identify opportunities to improve your model. As always, model improvement is an iterative process. As you make changes to your dataset, you can compare performance (i.e. mAP) to measure the impact of a change.