
Remote camera streams can be an effective way to monitor multiple locations in real-time. Computer vision can quickly amplify the value of those streams by providing analytics to maximize the value of each camera. Using existing cameras and making them AI-enabled is a great way to begin using AI in any physical location whether for occupancy analytics, security augmentation, infrastructure monitoring, or workplace safety.
In this guide, you will learn how to build a real-time road congestion system using computer vision. We will start with visualizing boxes for one camera, then work our way up to determining congestion across multiple cameras, and end with a system that can monitor multiple streams from an NYC road camera data source.
Create or Use a Computer Vision Model
For our project, we will use a vehicle detection model already available on Roboflow Universe. You can use stream processing for almost any vision model, including pre-trained Universe models, your own Roboflow models, or YOLO models trained on the COCO dataset.
For a different use case or production use, it may be better to train a new model or fine-tune it with your own data. See guides on how you can train YOLOv8 or YOLOv9 on your custom data.
Once you’ve selected a pre-trained model or trained your own, you’re ready for the next step.
Single Camera Stream Processing
Before we tackle multiple cameras, let’s start by processing one video stream. To do this, we will use the Inference Pipeline feature of the Inference package. InferencePipeline works on a system of input stream(s) (called video reference(s)) and output processes. (called “sink(s)”)
The video references can be local camera devices, video files, or URLs to links or streams. In this project, we will be using live webcam stream URLs provided by New York City’s Department of Transportation.
First, we will try running InferencePipeline using a default sink, render_boxes, to render and output bounding boxes.
from inference import InferencePipeline
from inference.core.interfaces.stream.sinks import render_boxes

pipeline = InferencePipeline.init(
  model_id="vehicle-detection-3mmwj/1",
  max_fps=0.5,
  confidence=0.3,
  video_reference="https://webcams.nyctmc.org/api/cameras/053e8995-f8cb-4d02-a659-70ac7c7da5db/image",
  on_prediction=render_boxes,
  api_key="*ROBOFLOW_API_KEY*"
)

pipeline.start()
pipeline.join()
After starting the InferencePipeline, we start seeing model predictions on live frames straight from the webcam, where we can see the packed streets near Times Square.
Now, let’s create a custom output sink. For this project, we want our output sink to do two things:
- Create a timelapse video of the live stream to review later
- Count and record the number of vehicles detected at any one time
First, we will do some setup:
- To keep a record of the vehicles, we will create and add to a Google Sheet (using the
gspreadpackage). - For recording our video, we will use
VideoWriterfrom the OpenCV (cv2) package. - Since the live stream will go on indefinitely, when we want to stop processing, we need a way to release the
VideoWriterso that it produces a valid video file. To do this, we will use thesignalpackage to intercept a keyboard interrupt and close out the video writer.
# Imports
from inference import InferencePipeline
from datetime import datetime
import pytz
import supervision as sv

# Google Colab
from google.colab import auth, userdata
api_key = userdata.get('ROBOFLOW_API_KEY')

# Google Sheet Setup
import gspread
from google.auth import default

auth.authenticate_user()
creds, _ = default()

googlesheets = gspread.authorize(creds)
document = googlesheets.open_by_key('1tNGjQSJQqQ7j9BoIw4VcxPn_DIcai8zxv_IwcSRlh34')
worksheet = document.worksheet('SingleCameraTest')

# VideoWriter Setup
import cv2
video_info = (352, 240, 60) # The size of the stream
fourcc = cv2.VideoWriter_fourcc(*'mp4v')
writer = cv2.VideoWriter("nyc_traffic_timelapse.mp4", fourcc, video_info[2], video_info[:2])

# Interrupt Handling
import signal
import sys

def signal_handler(sig, frame):
  writer.release()
  sys.exit(0)

signal.signal(signal.SIGINT, signal_handler)
Then, we will define our callback function, then our InferencePipeline again, and replace our on_prediction default sink with our new custom sink.
from inference import InferencePipeline
from datetime import datetime
import pytz
def on_prediction(predictions, video_frame, writer):
# Process Results
detections = sv.Detections.from_inference(predictions)
annotated_frame = sv.BoundingBoxAnnotator(
thickness=1
).annotate(video_frame.image, detections)
# Add Frame To Timelapse
writer.write(annotated_frame)
# Format data for Google Sheets
ET = pytz.timezone('America/New_York')
time = datetime.now(ET).strftime("%H:%M")
fields = [time, len(detections)]
print(fields)
# Add to Google Sheet
worksheet.append_rows([fields], "USER_ENTERED")
pipeline = InferencePipeline.init(
model_id="vehicle-detection-3mmwj/1",
max_fps=0.5,
confidence=0.3,
video_reference="https://webcams.nyctmc.org/api/cameras/053e8995-f8cb-4d02-a659-70ac7c7da5db/image",
on_prediction=lambda predictions, video_frame: on_prediction(predictions, video_frame, writer),
api_key=api_key
)
pipeline.start()
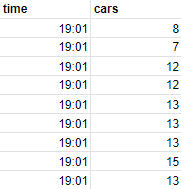
pipeline.join()As the stream starts being processed, we see the Google Sheet start populating with vehicle counts.
After we stop the stream, we can check out the time-lapsed video along with the complete graph.
The timelapse video playing at 5x speed (left) and the graph generated from the vehicle counts in the spreadsheet (right) (bar was added in post-processing)
Multi-Camera Stream Processing
InferencePipeline makes it simple to drop in a camera stream and run computer vision models on it, and with some modifications to our code, we can make it run on several different streams.
For this project, we will use three different street cameras to keep track of the stream URLs and street locations. We will also need to create separate VideoWriter instances for each camera.
cameras = {
    "5th Ave @ 34 St": "https://webcams.nyctmc.org/api/cameras/3a3d7bc0-7f35-46ba-9cca-75fe83aac34d/image",
    "2 Ave @ 74 St": "https://webcams.nyctmc.org/api/cameras/6316453d-6161-4b98-a8e7-0e36c69d267c/image",
    "E 14 St @ Irving Pl": "https://webcams.nyctmc.org/api/cameras/f9cb9d4c-10ad-42e4-8997-dbc9e12bd55a/image"
}

camera_writers = [
    cv2.VideoWriter(f"{location}.mp4", fourcc, video_info[2], video_info[:2]) for location in cameras.keys()
]
Then, we will modify our sink and create a camera processing function.
from inference.core.interfaces.stream.inference_pipeline import SinkMode

def process_camera(predictions, video_frame, location):
  # Process Results
  detections = sv.Detections.from_inference(predictions)
  annotated_frame = sv.BoundingBoxAnnotator(
      thickness=1
  ).annotate(video_frame.image, detections)
  vehicles = len(detections)

  # Add to Google Sheet
  ET = pytz.timezone('America/New_York')
  time = datetime.now(ET).strftime("%H:%M")
  worksheet = document.worksheet(location)
  print(location,"has",vehicles,"cars")
  fields = [time, vehicles]
  worksheet.append_rows([fields], "USER_ENTERED")

  return annotated_frame

def on_prediction(predictions, video_frame, camera_writers):
  idx = video_frame.source_id
  annotated_frame = process_camera(predictions,video_frame,list(cameras.keys())[idx])
  camera_writers[idx].write(annotated_frame)

pipeline = InferencePipeline.init(
  model_id="vehicle-detection-3mmwj/1",
  max_fps=0.5,
  confidence=0.3,
  video_reference=list(cameras.values()),
  on_prediction=lambda predictions, video_frame: on_prediction(predictions, video_frame, camera_writers),
  api_key=api_key,
  sink_mode=SinkMode.SEQUENTIAL # Sequential mode means each prediction will trigger one sink call
)

pipeline.start()
pipeline.join()
Once we start the pipeline, the sheet will start populating again and once we stop it, we can combine the generated graphs with the time-lapsed videos.
Conclusion
Using the Inference package, we were able to analyze several live streams from various locations around New York City. This project can be adapted and extended to monitor video streams from almost any source for any use case from retail camera analysis to insights for occupancy statistics.